
Introduction
High sensitivity EBSD, also known as high resolution EBSD is now in general use for the determination of elastic strain and very small rotations1. Below are shown measured rotations, and normal strains using this technique to investigate grain boundary effects in an annealed sample of nickel-based superalloy.
The patterns were recorded at 512×512 by 12 bit deep resolution using an EDAX_TSL Hikari camera in an FEI FEG SEM. They were analysed using BLG Productions Ltd Crosscourt 3 software.
Analysis
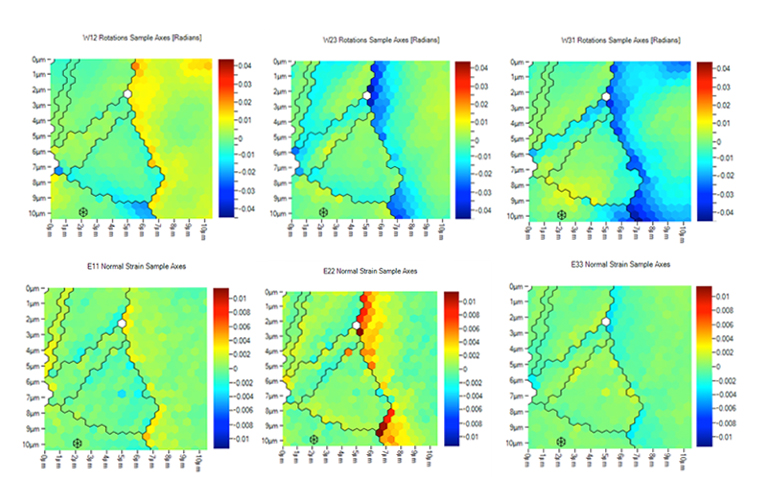
The central grain shows little variation in orientation within it, less than 0.0008 radians (0.04 degrees) except at the lower grain boundary where it rotates by up to 0.01 radians (Ɛ13). This has triggered an equal rotation in the adjoining grain which decreases as we move away from the boundary. The large grain on the right of the map also has a central zone relatively free of any bending but with a much steeper rise in rotation as the grain boundary on the left is approached. The rotation reaches 0.02 radians or just over 1 degree. The Ɛ22 normal strains range between 5×10⁻⁵ and 5×10⁻⁴ in the central parts of the grain but rise at the grain boundaries on the left. Generally the rise is to levels of ±0.004 but reached 0.008 at one point. These values are significantly above the macroscopic yield strain of about 0.001. They are generally very short range 0.5µm to 1.5 µm. Such an observation needs to be examined.
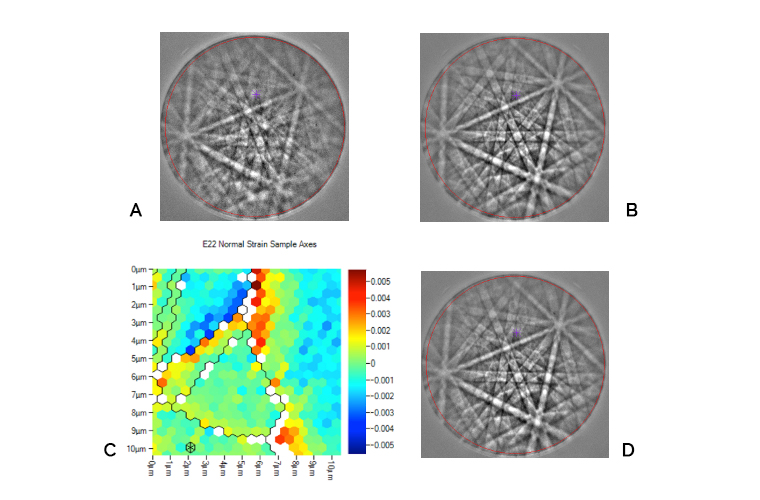
Figure 2 A is an EBSD pattern from one of these points near the grain boundary where the raw measurements indicated high strain. The relevant reference pattern is shown in Figure 2 B. 2 A is clearly the superposition of two patterns, the second originating in the adjacent grain and is the reason for the anomalous strain value.
Such anomalies are filtered out in Figure 2 C using an automatic procedure based on the mean angular fit error, which is a measure of the difference between measured shift of the EBSD pattern within each region of interest and the theoretical shift that should occur for the output strain tensor.
However this does not remove all pixels with strain levels above the macroscopic yield point. It leaves some pixels with Ɛ22 = 0.005 radians and yet low mean angular error of 2.68 x 10⁻⁴ radians. Figure 2 D is an EBSD pattern from one of these pixels.
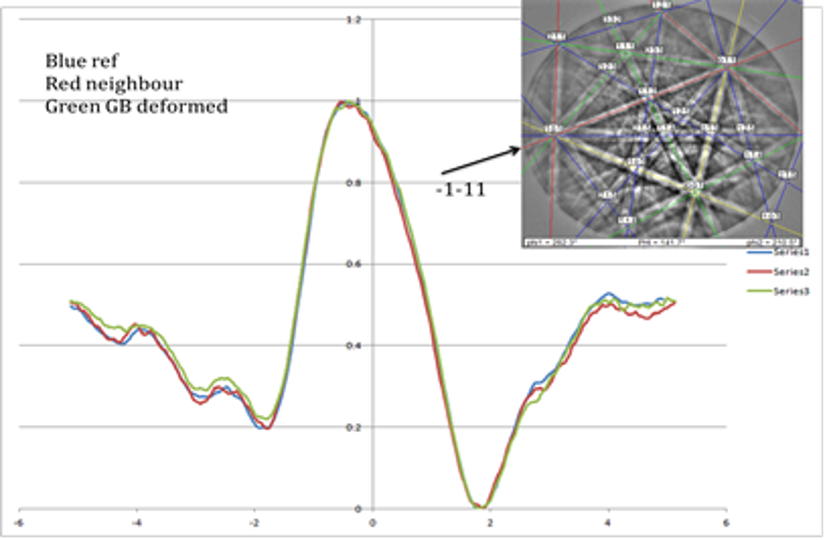
Another possible cause of the anomalous strain measurement is that the diffraction bands are broadened and more diffuse which would be the case if there was significant dislocation activity at the grain boundary. One method of checking if this is the case is to determine band profiles directly of the reference pattern, its neighbouring pixel and from the pixel adjacent to the boundary exhibiting anomalous strain. The band profiles show no band broadening, diffuseness or shape change although there are some differences in the tails remote from the bands themselves. The profiles give no reason therefore to reject the ascribed strain.
At this stage therefore we can find no reason to reject the result that strains greater than the macroscopic yield point can exist.
Field: Materials Analysis Grain boundary strain
Authors: David J. Dingley
1 A J Wilkinson, G Meaden, David J. Dingley (2006) UltraMicroscopy 106 307-313